Setting new report
Access Reports are designed for printouts. The proposed structure of the graphical elements is filled with data from tables or queries, and printed on paper like Word documents. The difference between the reports and forms is mainly in the fact that the report do not serves to edit the data, make changes, deleting or inserting records. Reports on the contrary, knows a few tweaks, which are used only for printing. Both reports and forms are based on data, can display conditional formatting and controls, charts, images, etc. Additionally, it is possible to link the Form with the Report with a button and create the next element in the interactive database application, for example. print ready invoice template with actual data from table. If this guide has helped you, become a fan on Facebook and recommend this site to your friends, it can be useful for them too
Report wizard
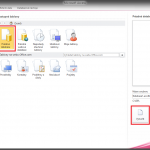
On the Create tab we activate the Report Wizard.
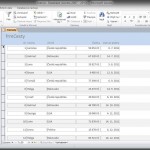
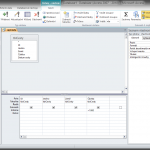
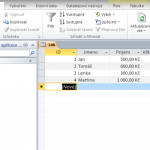
Gradually, we go through the steps of the form shown in the pictures below.
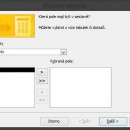
- Firstly, we choose a data source, which will report be created from. It can be a table or query, or more related tables. Arrows in the middle use to transmit columns you want to see in the report to the right.
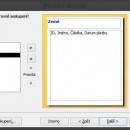
- In the second step, you can choose a field that is repeated in the data and that we want to organize into groups, eg. the state, category, etc.
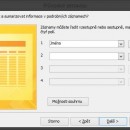
- You can set a field, according to which the records will be sorted alphabetically within the group.
- If the data is in numeric columns it offer for groups to create subtotal results.
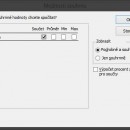
- Summary options displays the available numeric fields and user sets that function he wants the data to summarize. The results can be calculated for each group (in detail), and together for the whole report.
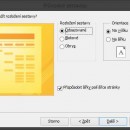
- The following is a basic graphic layout of components and report orientation.
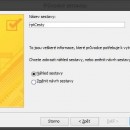
- Finally, we choose the name of the report. Usually we put prefix to the names according to the type of object, in this case, “rpt” from the English word “report”. Example names may be rptSummary or rpt_Summary.
After completing the wizard is still appropriate to graphically edit the report in Design view and fine-tune the placement and size of elements.
Report views
The Report has four types of view that can be switched on the Home tab> View.
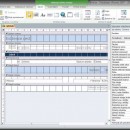
- Design View … allows you to design / modify the controls and their attributes, we do not see a preview of records.
- Layout View … some of the appearance and at the same time we see a preview of the records.
- Report view … does not allow changes in appearance, we see an endless list of records.
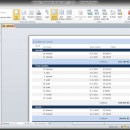
- Print Preview … mode, which shows the page margins and records, does not change the design.
The most important are the Design view and Print Preview.
Source Elatius database used for this example can be downloaded here.

Leave a Comment